
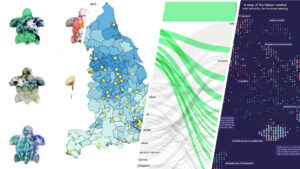
“Plateful Insights” is a collection of six hand built ceramic plates, each a unique narrative about global nutrition. These plates are not mere dining accessories; they are a tactile exploration of data, a physical manifestation of statistics that often remain trapped behind the screens of our digital devices. Each plate represents one of the six regions of the world and is sized according to the difference between the average supply of kilocalories (kcal) of food per person per day and the minimum kcal requirement per person. Their final size reflects the surplus food available to people in each region, providing a visual and tangible commentary on the disparities and abundance in global food distribution. The donut charts break down the percentage of daily kcal intake derived from fats, animal and vegetable proteins, and carbohydrates. This tactile experience encourages a more intimate and reflective interaction with the data, fostering a deeper understanding of global nutrition issues.

“Plateful Insights” is a collection of six hand built ceramic plates, each a unique narrative about global nutrition. These plates are not mere dining accessories; they are a tactile exploration of data, a physical manifestation of statistics that often remain trapped behind the screens of our digital devices. Each plate represents one of the six regions of the world and is sized according to the difference between the average supply of kilocalories (kcal) of food per person per day and the minimum kcal requirement per person. Their final size reflects the surplus food available to people in each region, providing a visual and tangible commentary on the disparities and abundance in global food distribution. The donut charts break down the percentage of daily kcal intake derived from fats, animal and vegetable proteins, and carbohydrates. This tactile experience encourages a more intimate and reflective interaction with the data, fostering a deeper understanding of global nutrition issues.
“Plateful Insights” is a collection of six hand built ceramic plates, each a unique narrative about global nutrition. These plates are not mere dining accessories; they are a tactile exploration of data, a physical manifestation of statistics that often remain trapped behind the screens of our digital devices. Each plate represents one of the six regions of the world and is sized according to the difference between the average supply of kilocalories (kcal) of food per person per day and the minimum kcal requirement per person. Their final size reflects the surplus food available to people in each region, providing a visual and tangible commentary on the disparities and abundance in global food distribution. The donut charts break down the percentage of daily kcal intake derived from fats, animal and vegetable proteins, and carbohydrates. This tactile experience encourages a more intimate and reflective interaction with the data, fostering a deeper understanding of global nutrition issues.
“Plateful Insights” is a collection of six hand built ceramic plates, each a unique narrative about global nutrition. These plates are not mere dining accessories; they are a tactile exploration of data, a physical manifestation of statistics that often remain trapped behind the screens of our digital devices. Each plate represents one of the six regions of the world and is sized according to the difference between the average supply of kilocalories (kcal) of food per person per day and the minimum kcal requirement per person. Their final size reflects the surplus food available to people in each region, providing a visual and tangible commentary on the disparities and abundance in global food distribution. The donut charts break down the percentage of daily kcal intake derived from fats, animal and vegetable proteins, and carbohydrates. This tactile experience encourages a more intimate and reflective interaction with the data, fostering a deeper understanding of global nutrition issues.

Client: Code4Romania Year: 2020 Project objective: In 2020, Code for Romania created The Donors Platform with the purpose of ensuring the transparency of data about

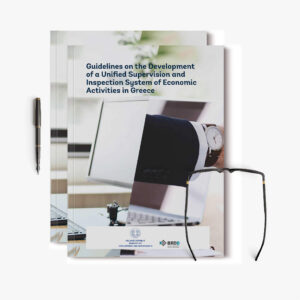
Client: World Bank Group Year: 2021 Project objective: This report was a study of the extent to which the rights of persons with disabilities are

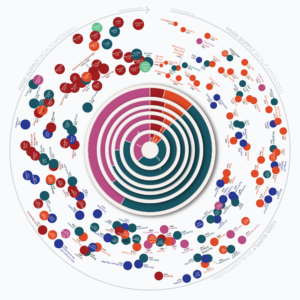
Client: Ashoka Romania Year: 2022 Project objective: Five years after the first Changemakers Map, Ashoka Romania commissioned in 2022 a new research dedicated to local
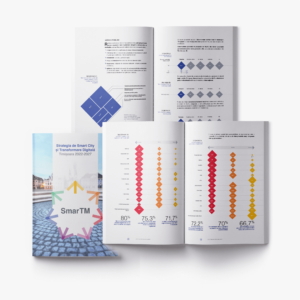
Client: Timișoara City Hall Year: 2022 Project objective: Timișoara City Hall launched a public consultation for its Smart City Strategy and needed to communicate its

Client: HBO Romania Year: 2020 Project objective: HBO Romania wanted to promote their new original series about corruption, Tuff Money in a fresh and engaging

While we all strive for it, happiness is a hard thing to achieve. This was especially true for 2020 which according to the Hedonometer was
Alegerile parlamentare 2020 În ciuda importanței alegerilor parlamentare de duminică, prezența înregistrată a fost cea mai mică din ultimii 30 de ani. Toată lumea vorbește de marea

Acasă în pandemie Giorgia Lupi, una dintre persoanele cele mai creative din domeniul vizualizării de date, a documentat meticulos cum a arătat viața ei în
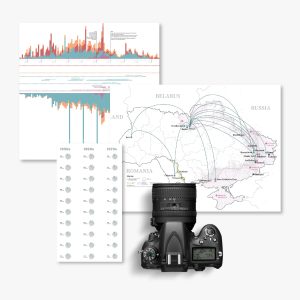
Efectele pandemiei asupra migrației muncii Timp de 4 luni am urmărit subiectul alături de o echipă internațională de jurnaliști care a investigat de ce industria

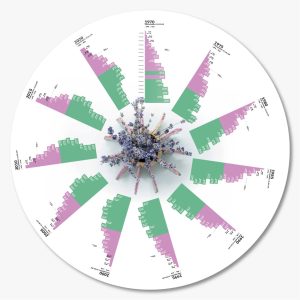
Românii și moralitatea Am lucrat alături de echipa glitch la vizualizarea rezultatelor studiului Semaforul Moralității, realizat pentru HBO România, ca parte din campania de lansare a
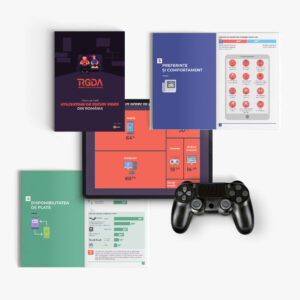
Client: iZi Data | Romanian Game Developers Association Year: 2020 – Project website Found this project inspiring? Working on a similar idea? Let’s get in
Client: World Bank Year: 2019 – Project website Found this project inspiring? Working on a similar idea? Let’s get in touch and discuss it! Drop

Client: Confederrația Patronală Concordia Year: 2019 – Project website Found this project inspiring? Working on a similar idea? Let’s get in touch and discuss it!

Client: Confederrația Patronală Concordia Year: 2019 – Project website https://interrobang.ro/wp-content/uploads/2020/11/Workforce-Analysis-Concordia-2.mp4 Found this project inspiring? Working on a similar idea? Let’s get in touch and discuss

Client: ASHOKA Romania Year: 2020 Ashoka Romania is committed to set up a long term process of building a local community of sports changemakers in

Client: ASHOKA Central and Eastern Europe | EIT Climate-KIC Year: 2019 In 2019 EIT Climate-KIC and Ashoka, the largest global organization promoting and supporting social

După seria de hărți și vizualizări de săptămâna trecută despre monitorizarea votului, a venit momentul concluziilor despre alegerile din SUA și analizei schimbării preocupărilor americanilor

Perioada dinaintea fiecărui tur de scrutin prezidențial reprezintă o adevărată cursă de înarmare pentru marile publicații americane. Doar la Washington Post există 5 echipe distincte

Pandemia a generat o nevoie globală, nemaiîntâlnită, de a înțelege și comunica pe înțelesul tuturor statistici oficiale, tendințe de răspândire ale virusului și date despre

La începutul lunii septembrie, Google a publicat o bază de date cu tendințele de căutare din America pentru 400 de simptomele asociate cu COVID-19, sperând

Uneori cea mai bună reprezentare a datelor nu este una vizuală. Data sonification (utilizarea sunetelor pentru a reprezenta date) este o tehnică din ce în

A trecut ceva vreme de la alegerile locale din acest an, însă de data asta, rezultatelor finale s-au lăsat mult așteptate, iar cele parțiale au fost

După închiderea secțiilor de votare la ora 21:00 și după multitudinea de știri despre schimbările surpriză din marile orașe ale României, cu toții ne întrebam

Nu ne-am fi apucat de vizualizări de date dacă nu eram încă de la început convinși că o imagine nu numai că spune mai mult
Săptămâna trecută povesteam cum, pornind de la articolul celor de la The Pudding despre procesul lor creativ, ne-am adus aminte de un proiect pe care tot îl

Citind articolul celor de la The Pudding despre procesul lor creativ – from idea to data story, am ajuns să ne întrebăm câte dintre proiectele noastre pornesc de

Gestaltism-ul este un concept dezvoltat din psihologie,pe la începutul secolului al XX-lea, care a pus bazele studiului modern al percepției, pornind de la ideea că
Am decis să scriem acest articol și pentru noi, pentru a ne convinge încă o dată care este abordarea corectă în contextul obiectivului nostru de

Client: Studio Interrobang Year: 2018 Back in the spring of 2018, we decided to make a test and see how well will a data-backed news

Client: Asociația MOJAR, Timișoara Year: 2018 96% of us own the apartments we live in, but do we really know where we live? Moreover, if
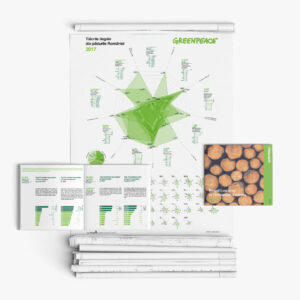
Greenpeace Illegal Logging Report 2017 Client: Greenpeace Romania Year: 2018 Every year, approximately 8.8 million cubic meters of wood is illegally cut from Romanian forests.

Client: Webeye Romania Year: 2018 WebEye is the leading telematics service provider in Central and Eastern Europe. For the 2018 WebEye technology report we were
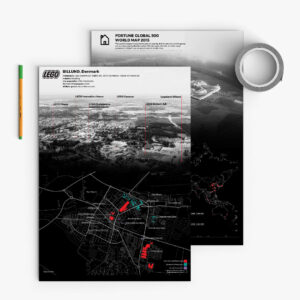
Client: Corporate Landscapes Magazine Year: 2016 Clusters, technopoles, milieus of innovation, science parks, company towns, corporate campuses and all other silicon-“things” are based on one

Client: APET, Romania Year: 2017 For APET Romania we designed a set of infographics describing the benefits of food ticketing services for consumers, companies and

Client: Scena9, Romania Year: 2019 Romania has the highest percentage of births among women under 20 in the European Union: 9.9% of the total number

Client: Studio Interrobang Year: 2020 For 9 days, together with four of our friends, we’ve collected 523 meals, snacks and drinks. We’ve created a shared

Client: Scena9, Romania Year: 2019 At first glance, it could be said that the Romanian cinema is doing very well. Every year there are films

Client: Decât o Revistă, Romania Year: 2013 The graph analyzes the way in which the coronavirus pandemic developed in Romania and the patients who spread

Client: Urboteca, Romania Year: 2013 Local public institutions and agencies are responsible for city management. Together, they make the city work: from the introduction of

Client: Urboteca, Romania Year: 2014 Urboteca is a mobile pavilion designed to make information on urban development processes and strategies accessible for the inhabitants of

Client: Romanian Chamber of Architects, Romania Year: 2018 Three-quarters of Romanian citizens live in apartment blocks – well above the European average; more than half

Client: Idrija 2020, Slivenia Year: 2016 The “TBI: youth, city and heritage” project was the response of a team of 30 young professionals from 7